How your construction project data could serve you better? This is the question we, at the ASHVIN team, ask ourselves daily!
We have developed the ASHVIN system based on Digital Twin technologies; it presents data in a visual format enabling to boost real-time management of construction projects. Furthermore, we have developed a Digital Twin platform connected to 10 smart digital twin-based applications, which have been tested at 10 real-life sites. Our Digital Twin platform enables us to collect, analyse and visualise a wide range of data collected from construction sites and engineered assets.
What is visualisation, and how is it used in the Construction sector?
Scientific visualisation refers to representing data in a visual format. It can be extremely effective as it takes advantage of the human brain’s perception ability. Visualisation technologies are the essence of real-time monitoring of physical assets and processes. However, to be effective, the visualisation should follow the rule of 3C’s; it should be clear, concise and complete.
Visualisation in Digital Twins represents the status of the physical and dynamic entity that provides explicit and useful knowledge for decision-making. To achieve this, the digital twin must transform complex data into useful and understandable visualizations. This is managed in a data-driven digital twin lifecycle that includes data collection, transmission, storage, processing, fusion, and visualization.
During the last decade, the visualisation of construction activities has been increasingly deployed, and it is considered one of the major IT domains in construction. The construction data used is generally gathered from heterogeneous sources (requirements, schedules, simulations, sensors, etc.) that must be correlated to the existing BIM models, ensuring consistency across project models and documentation along with the temporal dimension for developing construction digital twins. Moreover, Digital Twin in Construction requires data visualization tools to communicate the project status, deviations from the design intent or production plan, and any other anomalies.
💡 The first journey to the Moon is the Ancestor of Digital Twin
The concept of digital twins can be traced back to use by NASA in the 1960s during the first trip to the moon. NASA built exact replicas of everything that was launched into space. Before sending instructions to the astronauts by mission control, simulations were made to what could be called an “Analog Twin” to simulate decisions made before implementing them on the physical object thousands of kilometres away. Mission control could be considered a dashboard for the mission wherein all data was displayed and used to monitor and verify the status of the mission in real-time. At that time, with the available technology, the dashboard required the space of an auditorium.
How can one visualise construction and civil engineering projects with ASHVIN?
A construction project’s database is voluminous, containing data ranging from textual form to quantitative data and cost breakdowns. However, the application of construction Digital Twins on account of real-time measurements represents the construction site as a virtual entity.
The ASHVIN digital twin platform can visualise data in several formats based on the user’s needs:
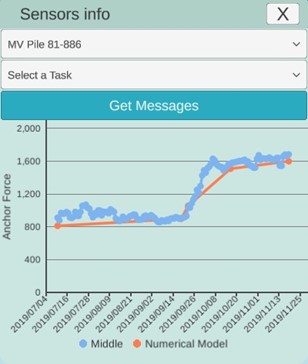
The sensor data visualisation feature enables to display of near real-time sensor measurements through sensors installed at the construction sites. Depending on the construction sites, these sensors can measure different values during the construction process, such as stress, strain, environmental values, camera footage etc. Following this, the measured data is sent to the ASHVIN IoT platform.
💡 The backbone of the ASHVIN Digital Twin platform is the ASHVIN IoT platform, based on the Mainflux solution, which is invisible to its end-users. This Internet of Things (IoT) platform enables to connect all devices, namely sensors, cameras, drones, etc., that are deployed at the construction sites to collect a varied range of data and then to communicate this data towards the Digital Twin platform for visualisation and simulation.
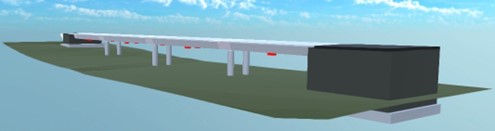
3D Visualisation is based on a construction site’s developed Building Information Model (BIM). Employing the 3D BIM model generates 3D visualizations and integrates information related to the facility, including geometric and functional properties. This function can be used to visualise assets not built yet, helping to communicate and visualise construction ideas.
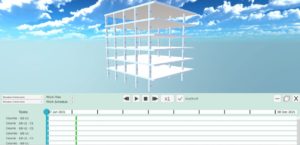
4D visualisation is developed in a virtual environment based on 4D modelling integrating time (i.e., the temporal dimension) with the 3D models (i.e., spatial dimensions). Construction planning is a collaborative and iterative process, and as projects shift towards integrated delivery, 4D visualization offers a common understanding of how information is represented. As such, 4D visualizations during the construction phase can boost planning, facilitate time-space conflict, support automated progress tracking, and provide a clearer view of the construction process. On the ASHVIN Digital Twin platform, the 3D models are linked to the construction sequence to generate 4D construction simulations, which can be simulated using the playback panel.
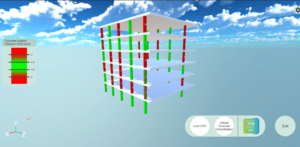
Visualisation of simulation data helps to understand and tune the model behavior. With the widespread implementation of digital twins, simulations can be done in almost real-time for data from IoT sources, such as stresses and strains by linking of simulation to real-time performance data. Simulation-based methods are developed on the ASHVIN Digital Twin for the early planning of construction activities and supply chain logistics. Additionally, the simulation-based planning tool aims to proactively address construction safety and quality issues.
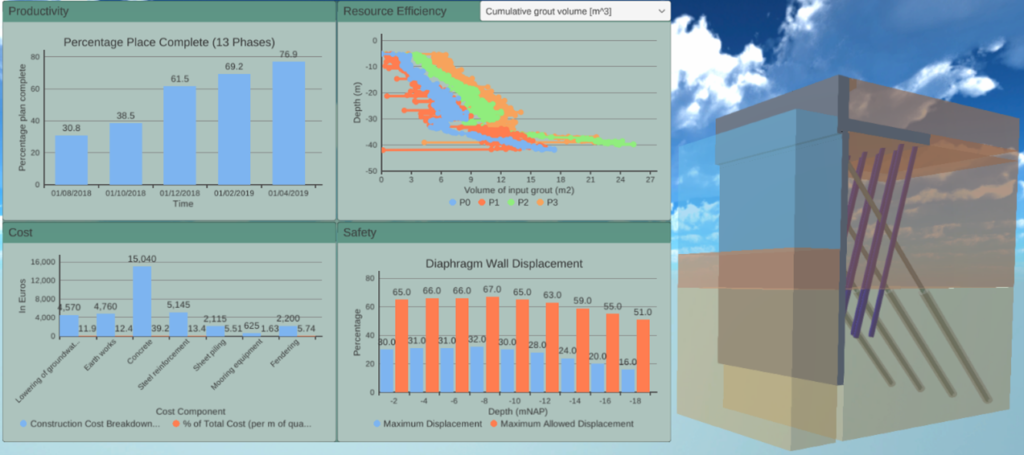
How the ASHVIN Dashboard supports construction managers?
The ASHVIN Digital Twin Platform Dashboard for the demo cases is developed to provide the construction manager or the responsible site personnel with an update on the construction and the associated construction management processes based on Digital Twin data measurements and capture technologies used at the construction site. It aims to communicate daily to the construction manager the project status visually, the associated performance indicators, divergence from the intended production plan and any other possible anomalies affecting the construction activities to support the decision-making process of planning for current and future construction.
During the last months of the ASHVIN project, our team continues to develop the Digital Twin Platform Dashboard further, making it even more user-friendly, meeting the target users’ needs identified at the ASHVIN demonstration sites even better.
📢 Would you like to try the ASHVIN Digital Twin Platform?
We propose a unique opportunity for European construction projects to onboard the ASHVIN platform, FREE OF CHARGE. We can onboard up to 50 projects on the platform, supporting the data collection from their construction site, analysing the collected data and creating a data visualisation model.
🚩 Join us now and read more about the Open Call here!
Stay tuned for more ASHVIN results, and connect with us through our LinkedIn or Twitter communities!